

Aerodynamic Optimization of a Car Body
Abstract
Abstract
Google Meet Link: https://meet.google.com/vhs-xtwe-eap
Team Members:
Mentors:
▸ Nallola Harshavardhan Goud (231ME330)
▸ Kushal S Gowda (231ME123)
▸ Mohammed Raheesh (231ME329)
▸ Nishadeep H (231ME131)
Mentees:
▸ Abhinav Reddy Sathi (241ME105)
▸ Anupama Rajreddygari (241ME213)
▸ Adi Nahata (241MN002)
Introduction:
This project effectively illustrates how aerodynamic optimization can efficiently minimize the drag coefficient of an automobile with the aid of computational fluid dynamics (CFD). By strategic design adjustments such as optimization of roof slopes, lowering frontal area, and rear tapering optimization.The 2D car model was optimized in order to maximize a lower aerodynamic resistance.
With Autodesk Fusion 360 for geometry development and ANSYS Fluent for simulation, the process allowed precise assessment of airflow patterns and performance effects. With a constant inlet velocity of 25 m/s and well-documented boundary conditions, simulation output proved a quantifiable decrease in CD validating the effectiveness of the design enhancements.
These findings emphasize the significance of aerodynamic efficiency in automotive design, laying the groundwork for enhanced fuel efficiency and performance under real-world conditions. Future research can take this study to 3D models and perform wind tunnel validation to further improve design precision.
Objective:
The objective of this project is to minimize the drag coefficient. To achieve this, we must achieve the following:
Streamlined shape allows air to pass easily around the vehicle, reducing flow separation and form drag. The body was formed into a teardrop shape—the most aerodynamically effective shape in fluid dynamics—with gradual curvature and a tapering rear.
Sloping both the front windshield and back window decreases stagnation pressure and postpones flow separation. A well-sloped rear section reduces wake turbulence behind the car, which is a significant source of drag in bluff bodies.
The bottom of a vehicle can induce a considerable amount of drag if it's filled with parts and uneven surfaces.
Smooth transitions from one body panel to another (e.g., hood to windshield, roof to back) avoid boundary layer separation. Curved contours and rounded edges keep the flow laminar for a greater distance along the body, thus lowering overall drag.
Approach:
A two-dimensional (2D) cross-sectional model of the vehicle was first created as a starting point in the design. This cross-section is the side profile or longitudinal cut of the car and captures important aerodynamic elements like the roof curvature, windshield slope, front and rear overhangs, and underbody geometry.
The main purpose of developing this 2D model is to perform initial aerodynamics analysis and optimization through computational fluid dynamics (CFD). Owing to the fact that 2D simulations are computationally less demanding, they enable swift testing of numerous design variations and their effects on the drag coefficient. The understandingdeveloped from these simulations guides the design of more aerodynamically optimized forms.


Relationship between Drag Force and Drag Coefficient:
FD = 0.5 x CD x A x ρV2
where:
FD: Drag Force
CD: Drag Coefficient
A: Frontal area
ρ: Density of the fluid flowing over the car (density of air)
V: Flow velocity of the fluid relative to the car
Fd increases with:
- Increase in drag coefficient
- Increase in fluid density (ρ)
- Increase in frontal area (A)
- Increase in velocity (V) (drag increases with the square of velocity)
Minimizing Cd through design improvements leads to:
- Reduced aerodynamic resistance
- Better fuel efficiency
- Improved vehicle performance at higher speeds
Process of making the 2D model:

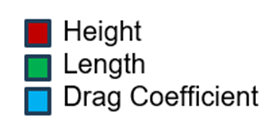
From the above image, it is observed that Model 3 is the most optimized model.
3D Models:
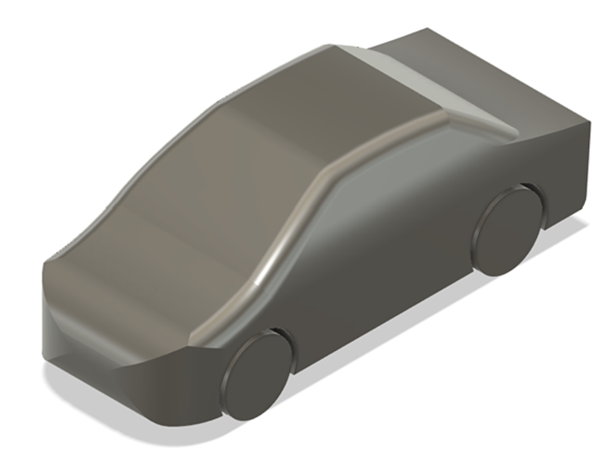
Model 1
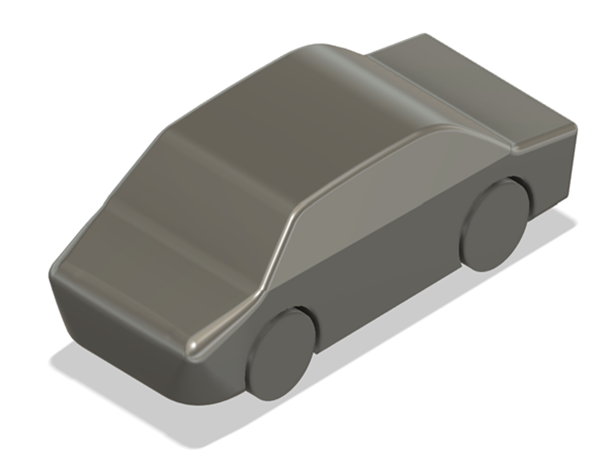
Model 2
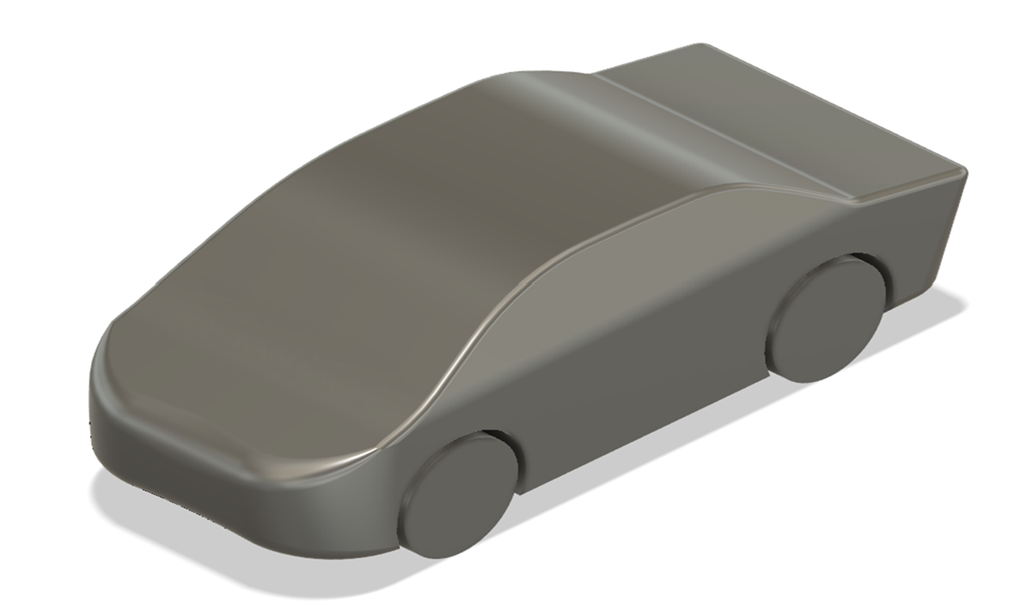
Model 3
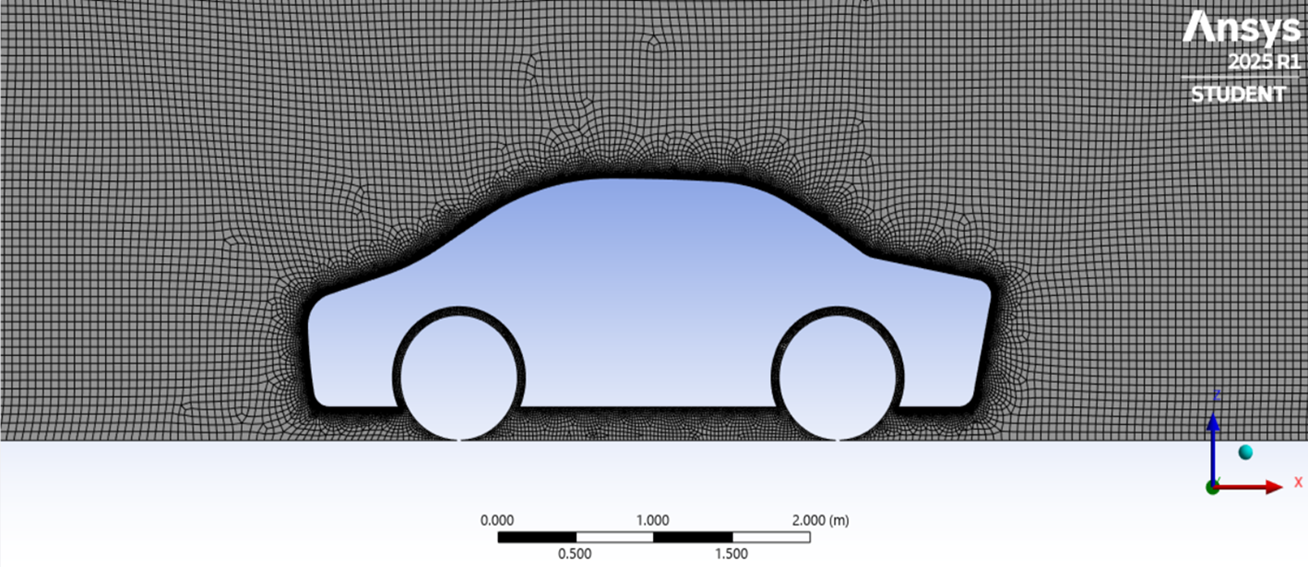
Meshing:
Meshing is a significant process in simulation in ANSYS, whereby the computational domain is broken down into small finite elements in which fluid flow equations can be solved numerically. A detailed mesh of the 2D cross-section of the car was created in this project in order to capture the geometry and the flow around the body of the car accurately.
To increase accuracy further, inflation layers were added close to solid surfaces to solve the boundary layer—a critical consideration in accurately calculating the drag coefficient. Mesh quality was assessed in terms of parameters such as skewness and aspect ratio to guarantee numerical stability and convergence..
Meshing of the car:
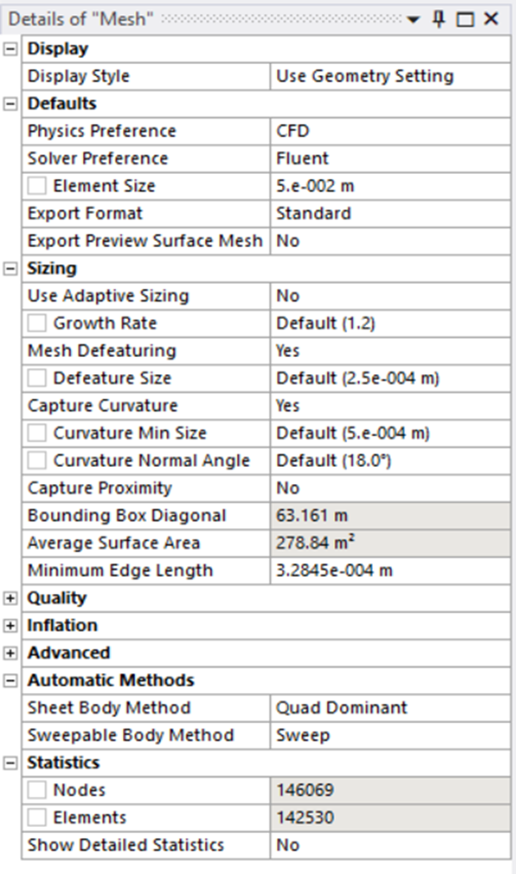
Details about the mesh:
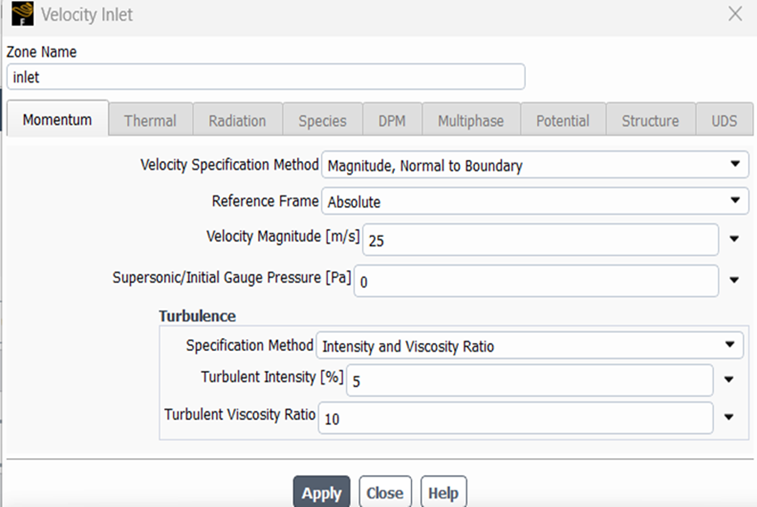
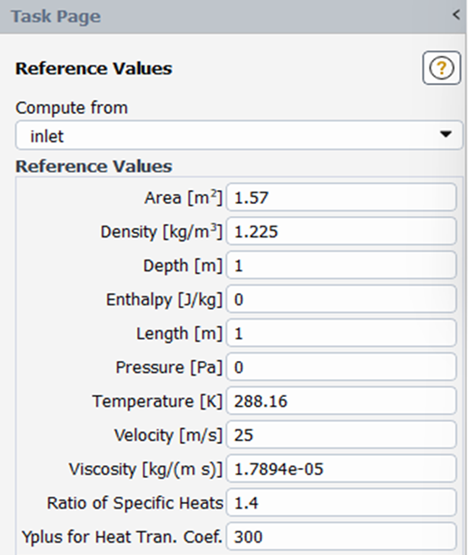
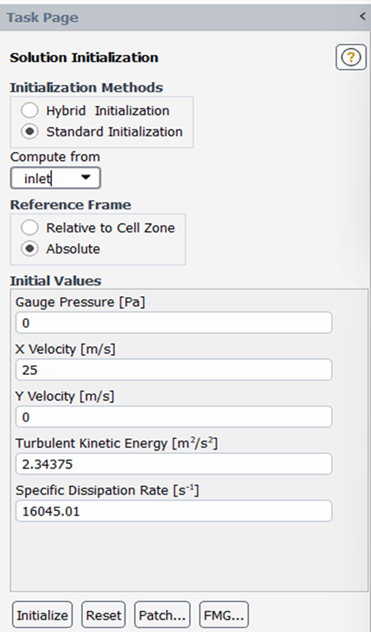
Solver Parameters:
Solver parameters are options that regulate how ANSYS numerically solves the governing equations (e.g., Navier–Stokes equations for fluid flow). Solver parameters decide the accuracy, stability, and speed of the simulation and need to be selected with care according to the problem type (steady vs. transient, laminar vs. turbulent, etc.).
▸Velocity Magnitude – 25 m/s
▸Tolerance – 10-6 (Absolute Criteria)
▸Number of iterations – 200

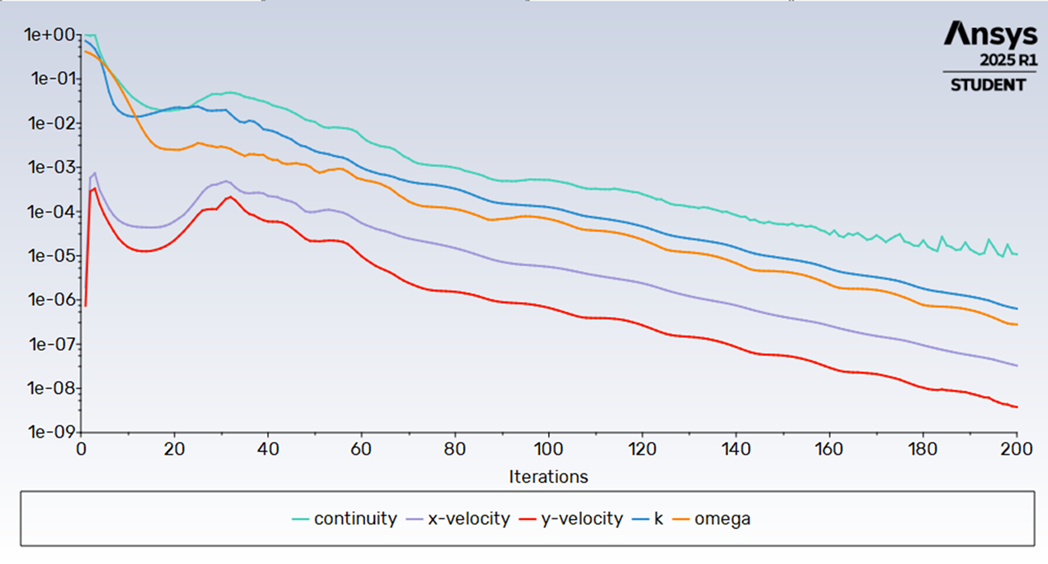
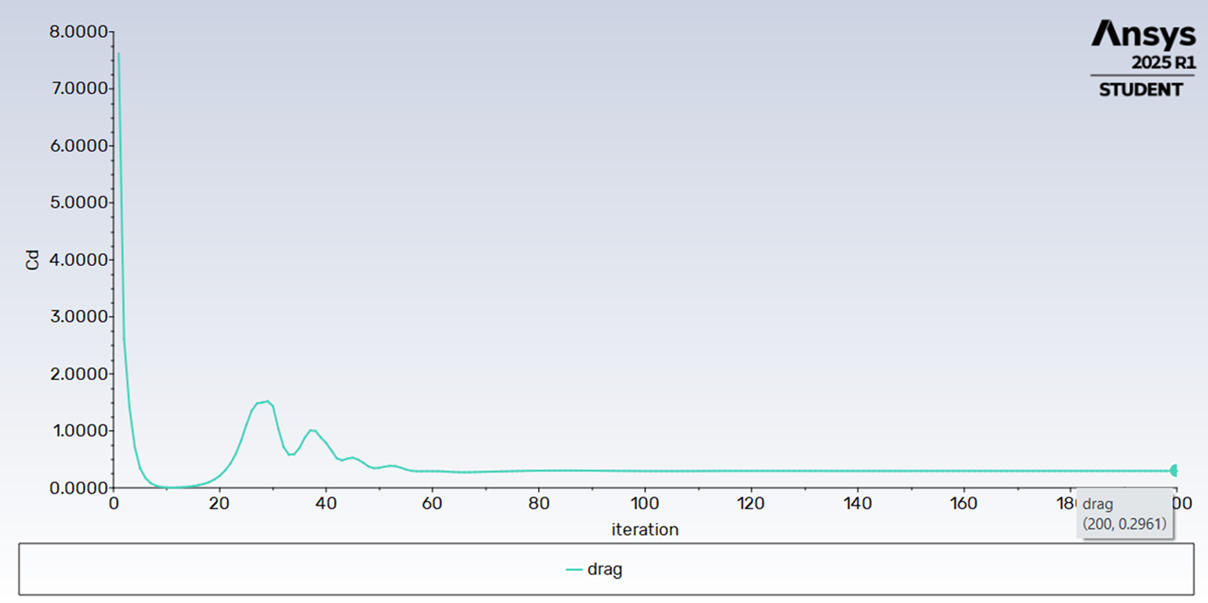
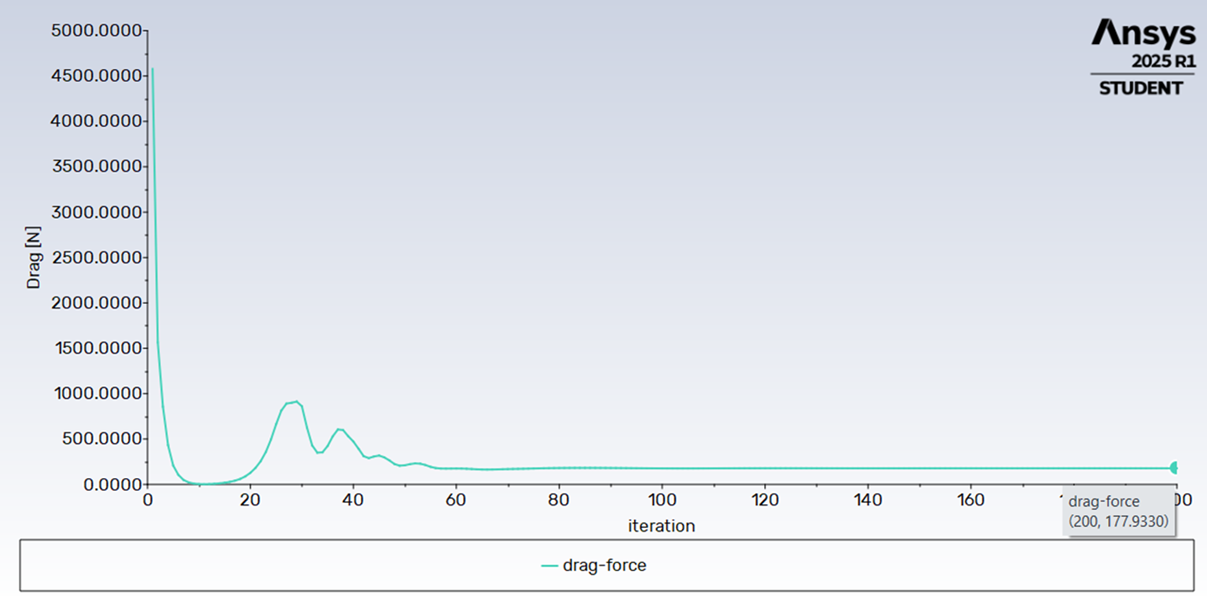
Scaled Residuals:
In ANSYS and other CFD solvers, residuals represent the imbalance or error remaining in the governing equations (like continuity, momentum, energy) after each iteration of the solver.
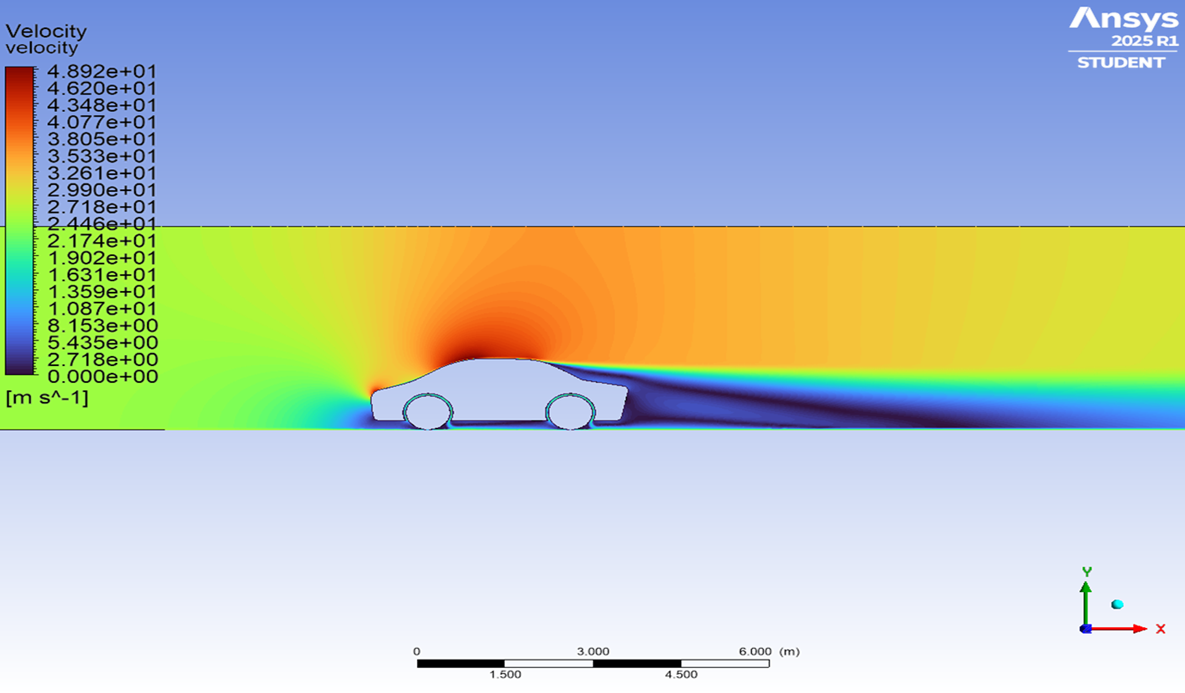
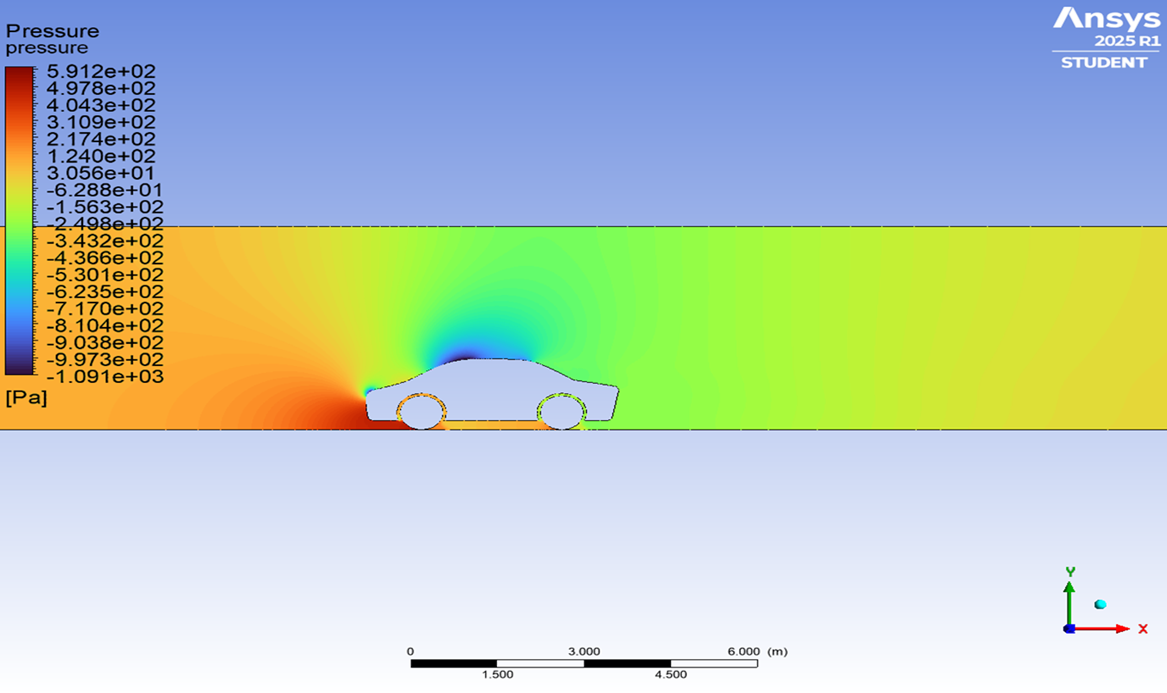
Velocity and Pressure Contours:
In computational fluid dynamics (CFD), pressure and velocity contours are basic visualization aids that facilitate the interpretation of the flow behavior over a body, like a car.
Velocity contours show the flow speed distribution around the vehicle and are vital in locating high-velocity and low-velocity regions. High-velocity regions usually occur over the streamlined roof and sides, whereas low-velocity regions tend to be situated at the back of the vehicle, where flow separation and wake formation take place. These make a considerable contribution to drag.
Pressure contours, however, show the static pressure distribution on the surface of the vehicle. They are essential in determining pressure drag, as a high-pressure area normally develops at the front (stagnation point) and a low-pressure area at the back. This pressure difference generates an overall force that acts in opposition to the motion of the car. Velocity and pressure contours combined supply essential knowledge of aerodynamic performance, allowing designers to optimize the shape for less drag and increased efficiency.
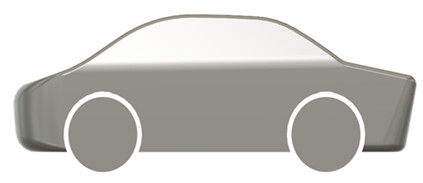
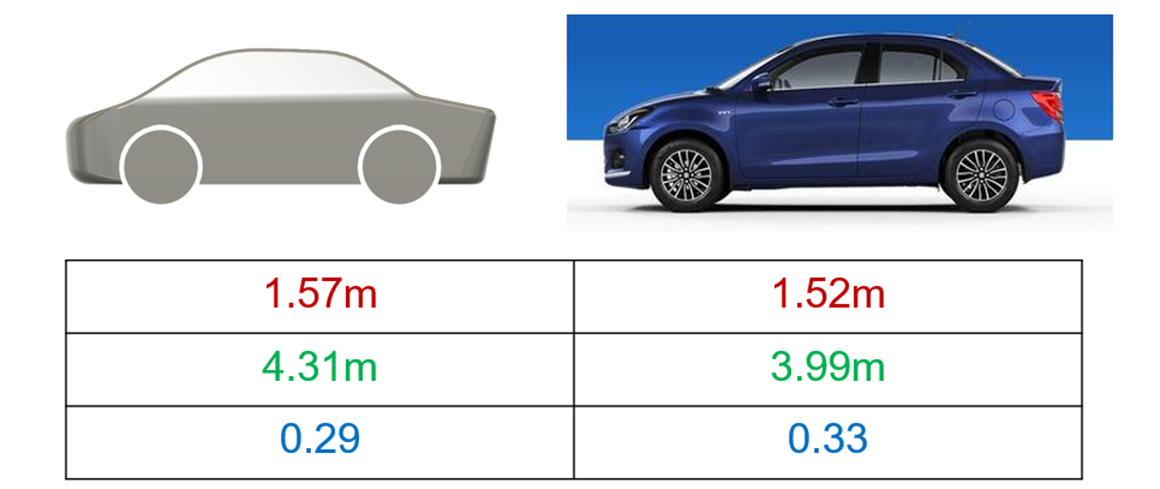
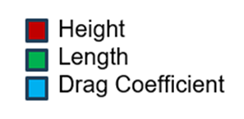
Comparison with Maruti Suzuki Swift Dzire (2018):
Conclusion:
In this study, a 2D car model was analyzed using ANSYS Fluent to investigate and minimize aerodynamic drag. By optimizing the vehicle’s external geometry and applying appropriate boundary and solver conditions, the drag coefficient was reduced by around 10% when compared to an existing model in the market.
The optimized design demonstrated a substantial decrease in CD, confirming the effectiveness of aerodynamic enhancements in reducing resistance. These results highlight the critical role of geometry in fluid flow behavior and lay a strong foundation for future 3D modeling or experimental validation.
References:
- Prof. Sathish H, Anish Rajendra Gaikwad, Darshan T V, Gokul R, Mohammed Rayan Habeeb, "Aerodynamic Analysis of Flow Over a 2D Sports Car using Computational Fluid Dynamics"
- CornellX: A Hands-on Introduction to Engineering Simulations
- Introduction To Ansys Fluent
- Ansys Analysis on modified 2D Car Body
Report Information
Team Members
Team Members
Report Details
Created: May 23, 2025, 7:59 a.m.
Approved by: Pranav Sudheer [Piston]
Approval date: May 25, 2025, 12:02 p.m.
Report Details
Created: May 23, 2025, 7:59 a.m.
Approved by: Pranav Sudheer [Piston]
Approval date: May 25, 2025, 12:02 p.m.